Different formats. More consolidation.
Different routes and descriptions mean time spent consolidating reports before deciding what to tackle.
QualityTrace combines defect-management software, practical guides, activation toolkits and expert guidance to help you put the established Auto Quality Matrix into daily use.
Watch the QualityTrace overview · Sound and captions available · Open video directly
Different routes and descriptions mean time spent consolidating reports before deciding what to tackle.
Missing origin makes it harder to see how far defects travel – and where prevention or earlier detection could reduce losses.
Pareto, 5 Whys and 8D help you prioritize, investigate and resolve problems. They don’t necessarily give you a shared view of where defects originate versus where they’re detected.
Connect where defects originate with where they’re detected. The Auto Quality Matrix makes recurring downstream discoveries visible, helping your quality team focus prevention at the source and investigate where earlier detection could reduce rework and losses.
Explore the example below.
| Detected ↓ / Origin → | Blanking | Welding | Assembly | Finish |
|---|---|---|---|---|
| Blanking | – | – | – | |
| Welding | – | – | ||
| Assembly | – | |||
| Finish | ||||
| Final inspection |
Colors indicate detection relative to origin – not severity or cost. The outline marks your selection.
The Auto Quality Matrix is an established quality method that predates QualityTrace. Synthetic defect-record counts, not affected-unit quantities or customer results. Only records with an established origin are included; unknown origins would need separate follow-up. This example assumes one forward route, without rework loops. Final inspection is a detection point, not a generating station. Periods have different durations: their totals do not indicate improvement. Counts alone do not establish root cause, defect rate, operator responsibility or financial impact. Some checks intentionally occur downstream; compare actual detection with the intended control plan.
Connect defect patterns with frequency, severity and available cost data, so your team can choose which problems deserve attention first.
Where defects start, where they’re found, and what keeps recurring.
Weigh impact, risk and potential avoidable cost.
Investigate the cause. Decide where to intervene.
Target the operation creating the problem to reduce recurrence.
Target detection and containment to limit additional work and losses.
Less avoidable scrap and rework.
More value from the people and expertise you already have.
Explore it with one of your own defects.
A free 90-minute workshop for your quality and operations leads.
Your team enters defect records using shared defect and station codes. The form records where each defect was found and prompts the team to establish its origin.
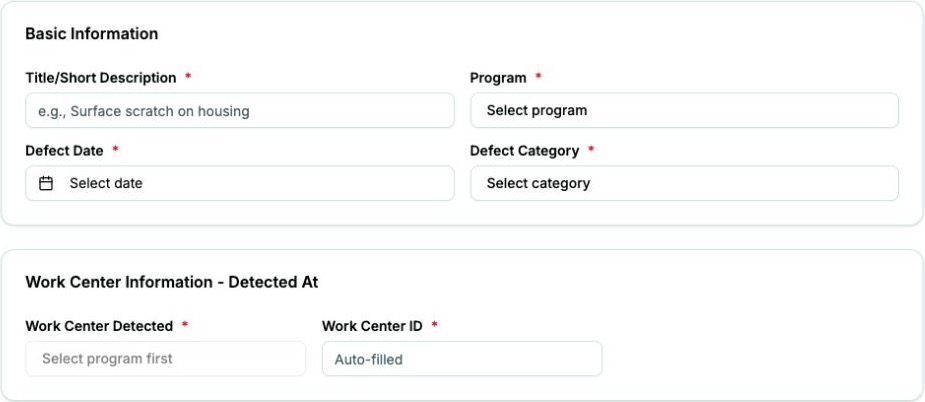 View full-size screenshot ↗
Your team investigates and records the originating station once established. The software does not infer it.
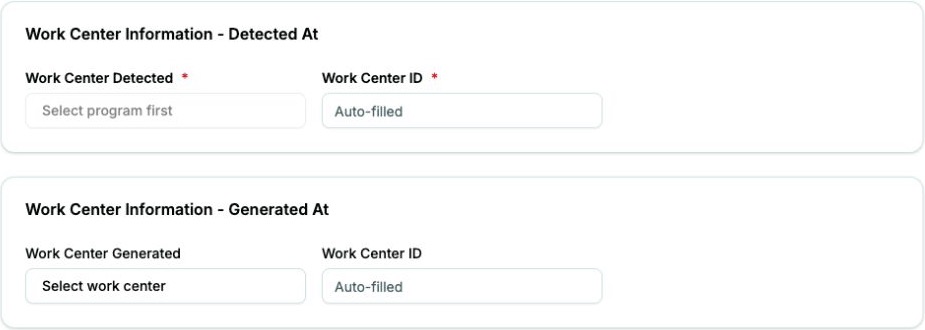 View full-size screenshot ↗
Read origin and detection together in the matrix. Use the patterns to focus investigation, containment and improvement.
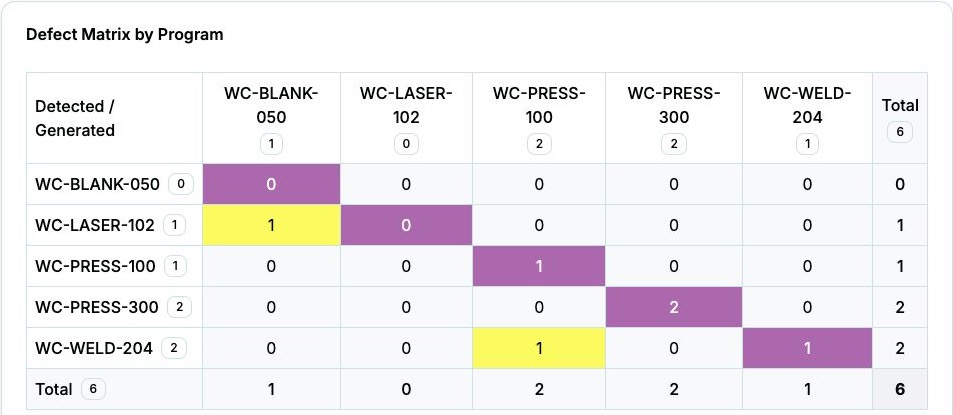 View full-size screenshot ↗
Compare estimated losses by defect category using your cost inputs. Recorded example values, not promised savings.
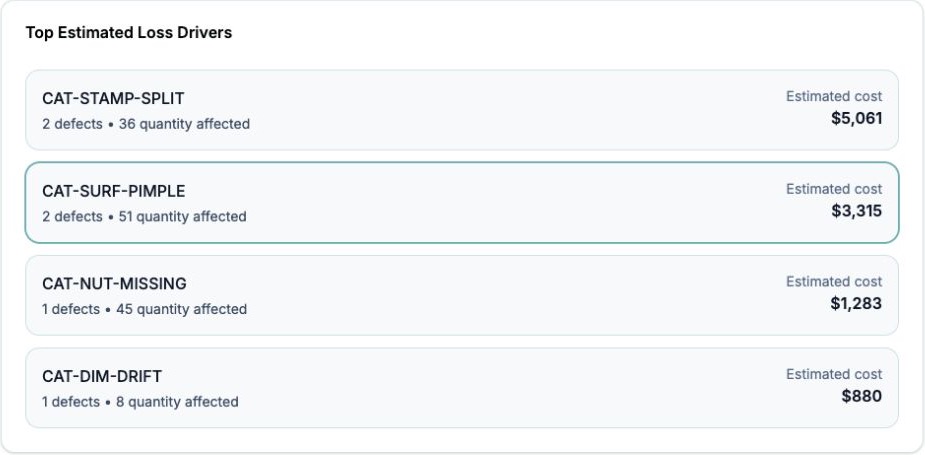
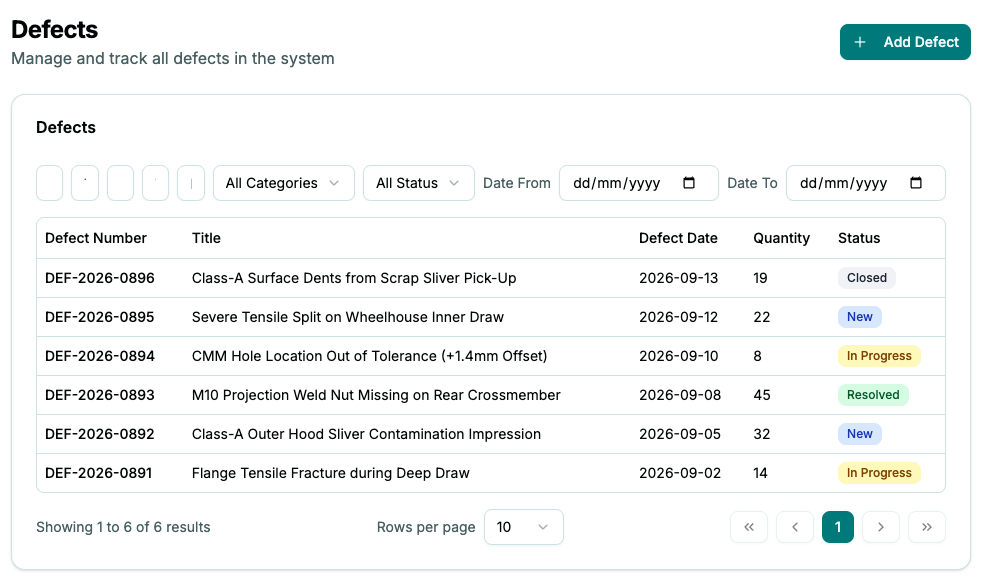
Assign defect tasks to people and monitor their progress. Track investigations from new to closed, using your quality reviews to discuss priorities and follow-up.
 View full-size screenshot ↗
QualityTrace is designed to sit alongside your quality management or ERP software, not replace it. In the workshop, we’ll explore which spreadsheet or consolidation tasks it could replace and where it might add work. Your team enters records manually; automatic integrations are not included, so we’ll assess the fit with your existing routines.
Use your plant’s numbers to explore the cost of poor quality and a hypothetical reduction. This is a scenario, not a forecast of QualityTrace results.
Count defective units, not defect reports. One part can have several recorded defects.
Your figures stay in this browser and are not saved or sent.
Estimated annual cost today
–Potential annual savings
–Enter a cost estimate and a reduction to explore.
See the package and investment belowEnter your figures in this calculator to explore payback.
Package price ÷ hypothetical annual savings × 12. This assumes savings accrue evenly. Excludes implementation time, IT costs and additional support. Actual savings depend on the changes your team makes.
Adjust your scenarioStart with losses you can reasonably estimate: scrap, rework labor, additional inspection, sorting and returns. Avoid counting the same loss twice. A partial estimate is useful; keep track of what it includes. Use USD consistently.
Annual cost is either the amount you enter, or defective units per month × average loss per defective unit × 12. Potential annual savings = annual cost × your chosen reduction percentage. The reduction applies to cost, not percentage points of defect rate. The volume route assumes your monthly volumes and average losses are representative. Your team must make changes to achieve any improvement; using the matrix does not guarantee savings.
Not sure of your numbers? Bring your current understanding to the free workshop. We’ll discuss what you measure and where the gaps are.

QualityTrace grew from hands-on work in real operations. It comes from the product studio of Future Operations, an operational transformation consultancy with manufacturing experience around the world. The matrix method has been applied across client plants; QualityTrace brings that experience into software and practical guidance.
Start on one line, then extend. Both implementation sessions are part of the paid package, separate from the free workshop.
You provide the IT environment and team time. Manual entry; no AI or automatic integrations in this version. Ongoing consulting and technology support are available separately.
One-time purchase. No software subscription. Perpetual license for one plant, across multiple lines. Includes agreed setup support in return for feedback every two weeks.
Intended standard price: US$30,000.
The defect management workshop is free. Purchasing the package is a separate decision, subject to assessing fit and IT requirements.
Explore how your plant manages defects today, where the quality matrix could help, and what putting it into practice would involve. No obligation to purchase.

Daniel has brought the Auto Quality Matrix into client plants and worked it through with their teams.
The workshop works best with your quality manager and operations or plant manager: practical knowledge of the defects, alongside the support to act. Either of you can get in touch; Daniel will help coordinate attendance.
No reports or plant data needed beforehand – talk through a recent defect from memory.
Your team records where it was found first, then adds the originating station after investigation. QualityTrace does not detect defects, infer their origin or determine the root cause for you.
No. Cost tracking is optional. The session introduces the method whether you use it today or not.
No. The workshop is free and there is no obligation to purchase. Its purpose is to understand your approach, share the method and assess the fit. If you want to proceed, the next step is a letter of intent at the agreed price, subject to an IT check, before ordering.
The license is perpetual for one plant, across multiple lines, with source code included. Your IT team installs it in your environment. Delivery timing and final scope are agreed before purchase. Founding setup support, onboarding and product-use support have an agreed scope and duration. Additional consulting and technical support are paid separately. We confirm modification rights, bug-fix and security-update arrangements, and future-version terms before purchase. Your plant owns its data; any setup or support access is agreed with you.